Abstract
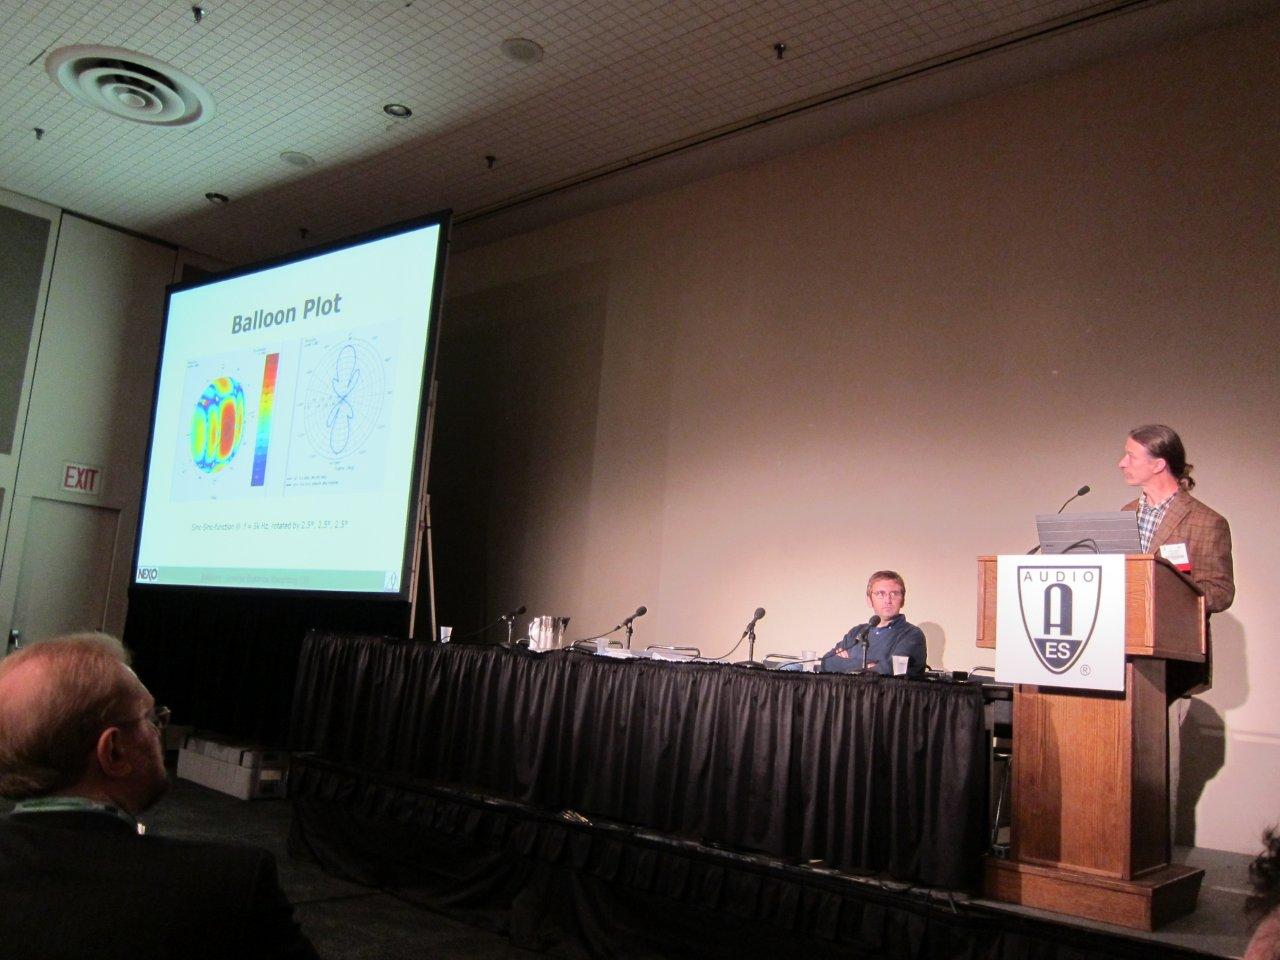
This paper investigates an extrapolation for missing directivity-data in connection with Balloon-Plots. Such plots display the spherical directivity-pattern of radiators and receivers in form of contoured sound pressure levels. Normally the directivity-data are distributed evenly so that at each point of the display-sphere there would be sufficient data-points. However, there are circumstances where we want to display data that are not evenly distributed. For example, there might be only available the horizontal and vertical scans. The proposed Inverse Distance Weighting method is a means to extrapolate into these gaps. This paper explains this method and demonstrates some examples.
Please click here to see the pdf of Joerg’s paper.


